Database of Regional
Climate Change

Harmonised daily climate indicators at country, state, and district level, 1950 – 2025

Explore the tools Download data

Overview

The Database of Regional Climate Change (DRCC) provides a unified repository of harmonised, global weather data for scientific analysis. Based on the Copernicus ERA5 dataset (ECMWF), complemented by CEMS Fire Historical v1 and wet-bulb temperature from the World Bank Climate Change Knowledge Portal, it covers daily climatological indicators since 01 January 1950 at three administrative levels:

  • Country level (admin-0) — 200 units across 194 sovereign countries
  • State level (admin-1) — 3,326 units
  • District level (admin-2) — 39,096 units

The database contains six primary indicators (mean and maximum temperature, total precipitation, fire-weather index, Keetch-Byram drought index, and wet-bulb temperature) plus eight derived indicators covering heat days, cold days, flood-risk days, temperature variability, thermal-stress exposure, and two composite heat indices.

Two interactive tools accompany the data: an interactive climate-vulnerability map and a geocode-to-region matching tool.

Citation:
Ganslmeier, M., Bettarelli, L., Furceri, D. and Schiffbauer, M. (2026). Harmonised daily climate indicators at country, state, and district level, 1950–2025. Working paper.

Interactive Tools

Explore climate indicators through two interactive applications.
Interactive Map

Interactive Climate-Vulnerability Map

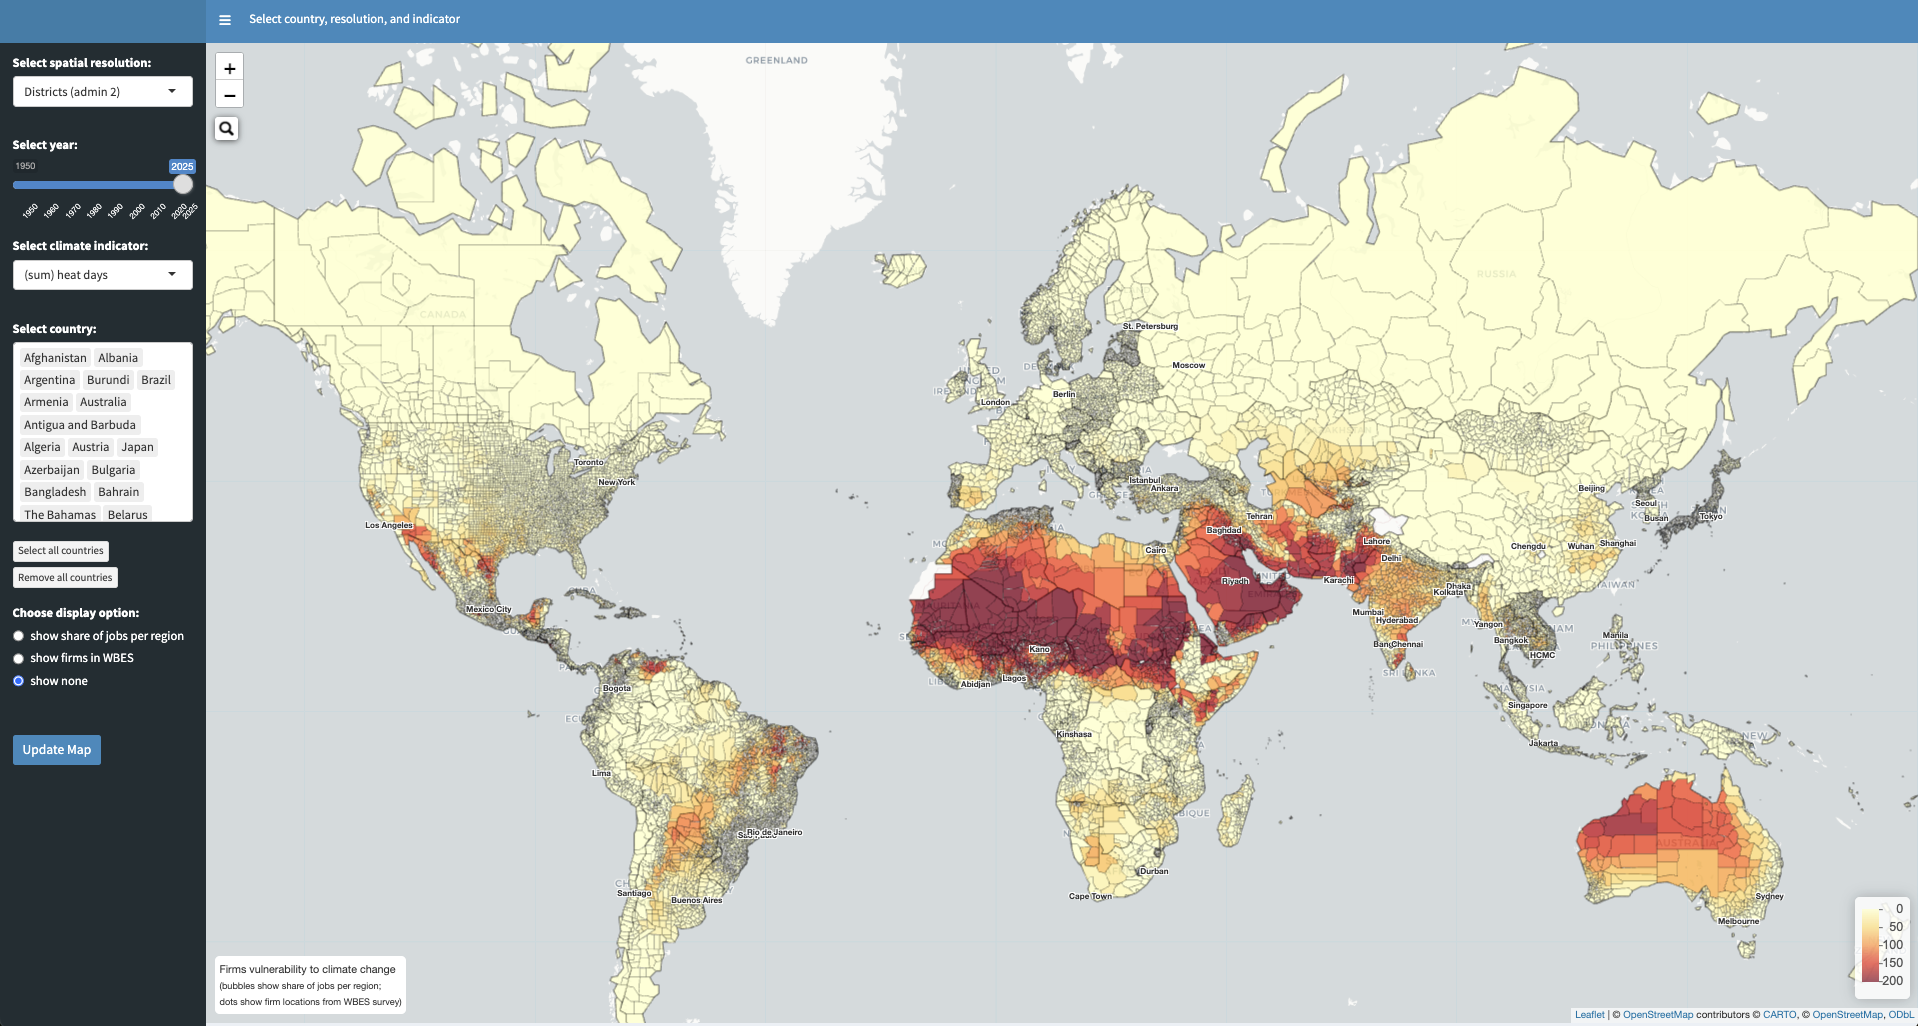
Explore 14 climate indicators at country, state, and district level from 1950 to 2025. Overlay geocoded firm locations from the World Bank Enterprise Surveys to assess climate-related economic vulnerability. Select a spatial resolution, year, indicator, and country scope to render the map. A sub-national employment-share overlay is under development and will be added in a future release.

Open Map
Geocode-to-Region Matching

Geocode-to-Region Matching

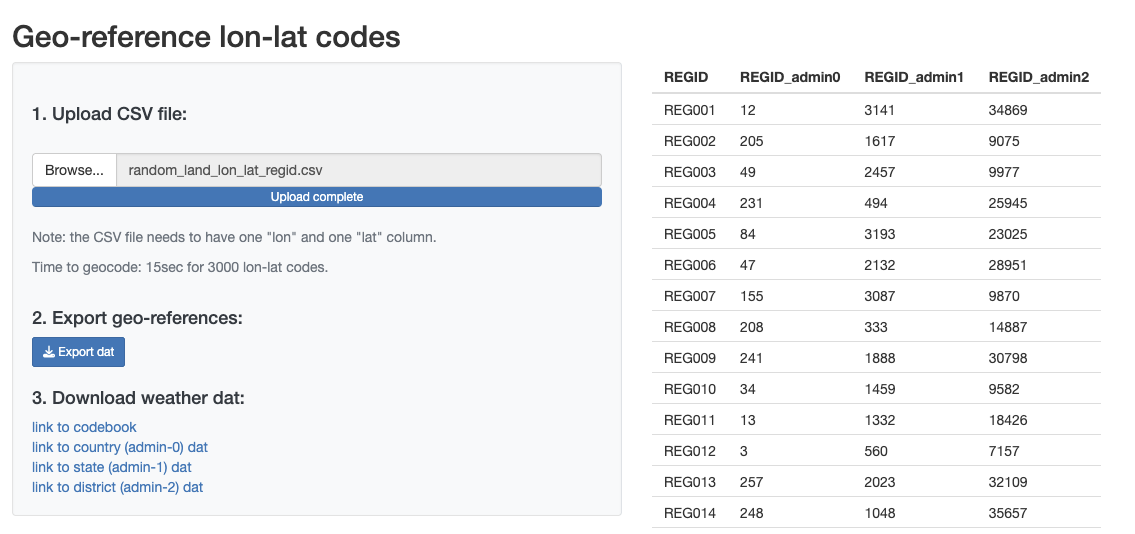
Upload a CSV of longitude-latitude coordinates and receive the matching DRCC regional identifier at all three administrative levels (admin-0, admin-1, admin-2). The result can be directly joined to any DRCC panel. Processing speed: approximately 15 seconds per 3,000 coordinates.

Open Tool


Download Data

All panels are freely available. Each contains daily climatological indicators from 01 January 1950 to 31 December 2025.

Country level (admin-0)

200 units (194 countries)
Daily, 01 Jan 1950 – 31 Dec 2025
.RData + .dta (Stata)

Mean & max temperature, precipitation, FWI, KBDI, WBT, heat/cold days, std. dev., heat indices

Download

State level (admin-1)

3,326 units
Daily, 01 Jan 1950 – 31 Dec 2025
.RData only

Mean & max temperature, precipitation, FWI, KBDI, WBT, heat/cold days, std. dev., heat indices

Download

District level (admin-2)

39,096 units
Daily, 01 Jan 1950 – 31 Dec 2025
.RData only

All indicators above plus flood-risk days (>20mm, >50mm precipitation thresholds)

Download

Annual aggregates

Pre-computed annual panels for all three admin levels. Same indicators as the daily panels, aggregated to annual means (temperature), annual sums (precipitation, counts), or annual maxima (FWI, KBDI). Distributed in .RData format; .csv copies are also provided for admin-0 and admin-1 (admin-2 annual is .RData only due to file size).

Download annual data

Metadata (META.xlsx)

Maps every REGID to its region name, country, admin level, and area in km². Essential for interpreting the data: without this file, numeric REGID values are not meaningful. Three sheets: admin-0 (200 units), admin-1 (3,326 units), admin-2 (39,096 units).

Download META.xlsx

Sources: ERA5 (ECMWF), CEMS Fire Historical v1, World Bank Climate Change Knowledge Portal
Shapefiles: World Bank Global Administrative Divisions

About

Questions or comments? Please do not hesitate to contact us.

Michael Ganslmeier

Michael Ganslmeier

University College London
Luca Bettarelli

Luca Bettarelli

University of Palermo
Davide Furceri

Davide Furceri

International Monetary Fund
Marc Schiffbauer

Marc Schiffbauer

World Bank